|
Multiple file import form (CDR focused) |
|---|
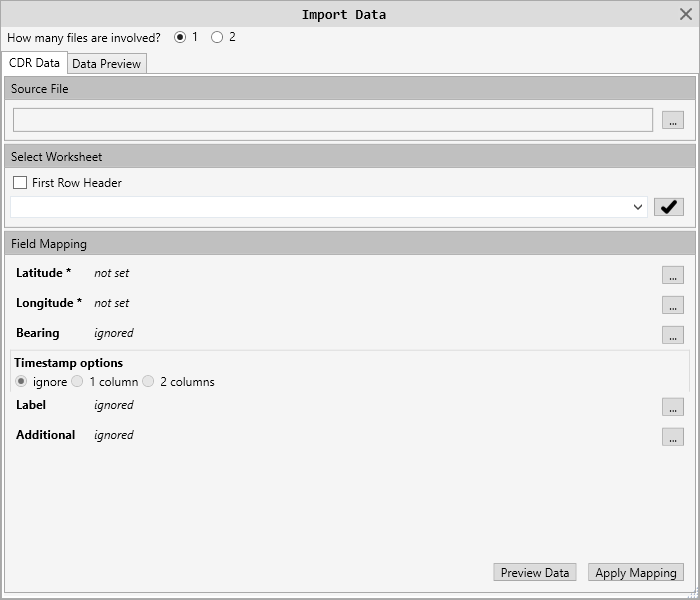
Currently the data can be imported into MapLink from a single file or multiple files.
At the time of writing this guide, accepted formats include .xls; .xlsx; .csv. (XML;KML will be added soon)
The MINIMUM required information for importing is Latitude and Longitude (in decimal format)
Getting started
1.You will need to select a “Source File”. This is the file that contains the data.
*The FIRST ROW of the file should contain header information for easier column mapping.
*If there are additional details at the top of the worksheet, these should be removed prior to attempting an import.
2.Once the file has loaded, you can then select the workbook that contains your data.
3.Check the “First Row Header” checkbox unless your file does not have this.
4.Click on the checkmark button to apply these selections and locate the columns. ![]()
*If the columns in the source file contain “Latitude”; “Longitude”;”Azimuth” they will be automatically mapped
5.Begin mapping fields
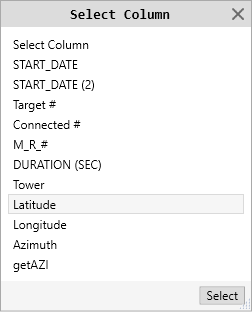
a.Click the elipses button [![]() ] to open the column selector for every field your file has
] to open the column selector for every field your file has
b.Timestamp can be ignored, one column, or two columns
c.Label will be the marker tooltip
d.Additional will place the values and column name in the notes section of the marker. This allows multiple column selections.
In the single column selection window, you can double-click the item to select it or select it and click the “Select” button.
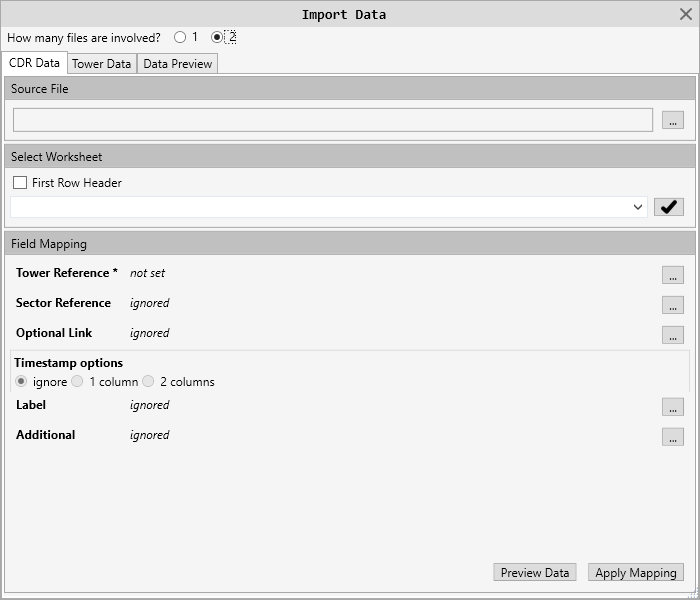
Multiple file importing
This importer is designed to load CDR data from 2 files where one file is the call data with reference to a tower, and the second is the tower file that contains the tower details such as location, heading, beam width and possibly other information.
In order for this importer to work, there MUST be at MINIMUM 1 column in the CDR file that references the TOWER file with the same values. See examples
Since there will be multiple calls mapping to the SAME location with this method, the markers will become a “stack” where only one marker will be shown at that location representing a group of markers. These “stacked” groups will have a unique icon to set them apart from the other markers on the map.
Once each file has had its’ columns mapped, click the “Preview Data” button. This will not show the data until BOTH files have been mapped. Once the preview is shown, click the “Apply Mapping” button to generate the markers from the data set.
The importer form should close and present you with the Layer properties form now showing your details in the “Markers” section. You can make whatever marker adjustments you need here and then close the form. Your markers should now appear on the map.