
A subpoena is normally required to obtain CDR files from a cell phone carrier or network. To locate towers for a subpoena, the website www.opensignal.com can be used to locate towers directly around the scene using a cell phone, or www.antennasearch.com to find towers in a more general area. If “antennasearch” is used only tower information should be requested as the antennas are for AM, FM, etc.
There are multiple files involved with CDR and plotting and it is important to understand what files are being received and what data is going to be plotted. Typical CDR files include the call detail records, tower mapping, where the towers are located and reference files to identify which towers are associated with which call details. Since there is no standard format or structure for these files, the outcome of the files depends entirely on the ability to correctly map the data from the supplied files. The files must be in XLS, XLSX or compatible file type.
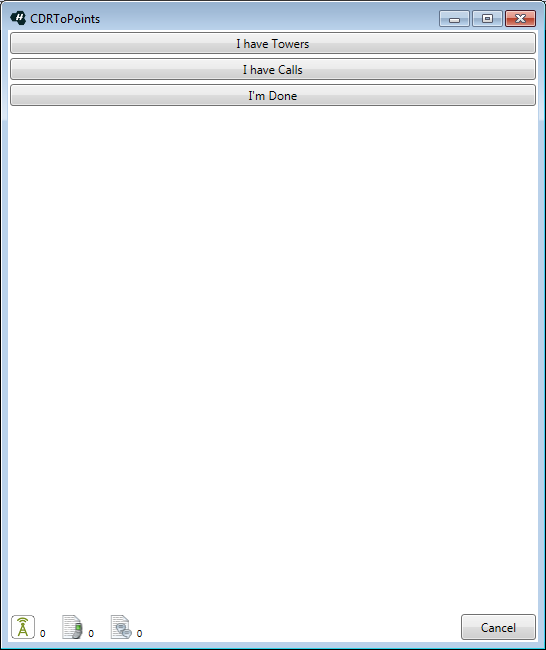
If the data to be plotted includes tower data, click <I have Towers> to enter the tower data for the plot.
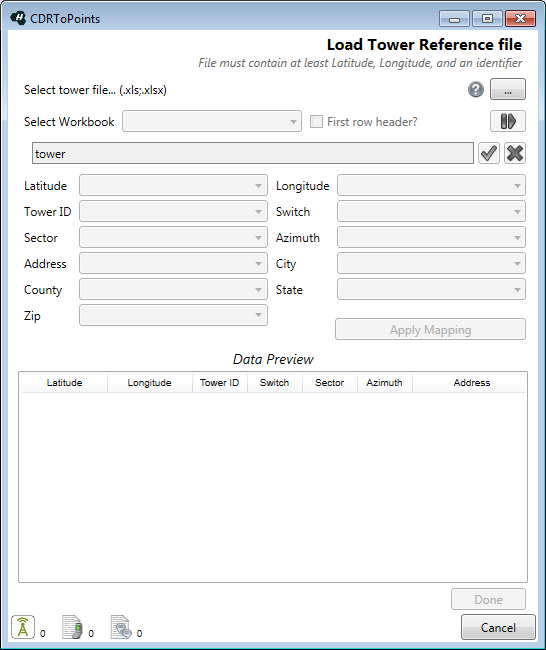
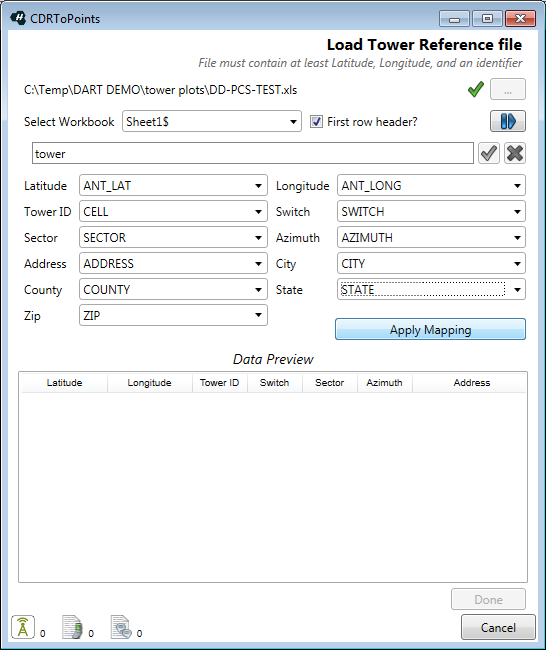
The tower reference file must have at minimum the latitude, longitude, and an identifier. Additional data may be provided and should be mapped if possible to assure an accurate tower plot. Select the tower file and indicate if the first row of the file has headings. Click the blue <Load> button and load the file.
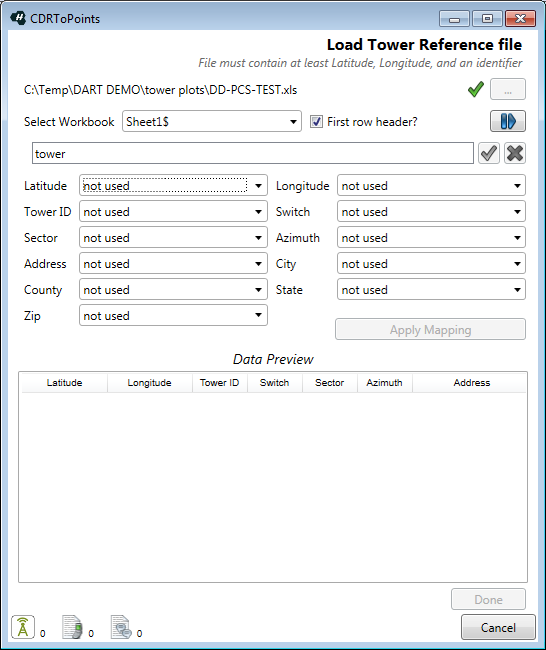
Map each field for the tower data using the drop down next to each field to be mapped. If the field is not in the file, select “not used” for that field.
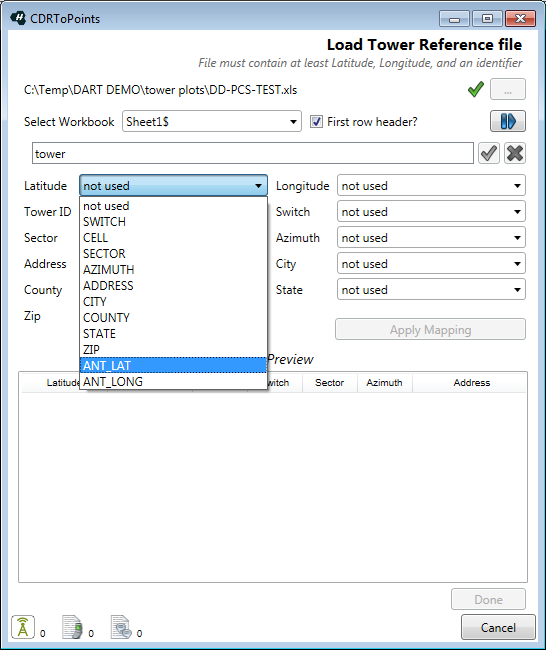
Continue this through the fields and click <Apply Mapping> when finished.
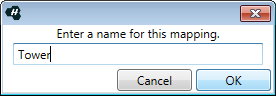
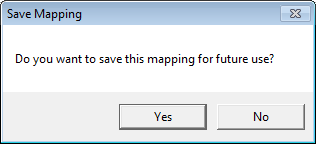
There is an option to save the mapping for future use. This can be helpful when importing multiple tower records from a given provider. To save the mapping for future use, click <Yes> in the dialog and give a name for the mapping. Click <OK> to save it.

The imported tower points are added to the tower reference file map Data Preview.
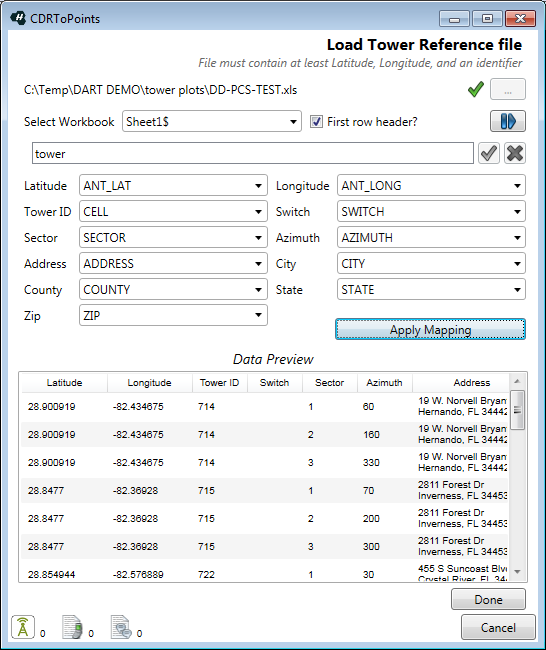
If the tower data appears to be correct, click <Done> to close the dialog box. The call details are the next type of data to be added. The number of tower entries is shown in the bottom left of the dialog box.
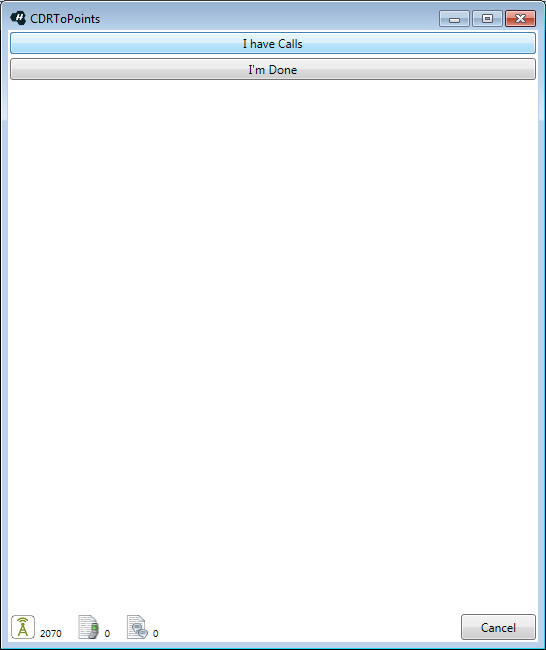
To load the call details, click <I have Calls> to enter the call details for the plot.
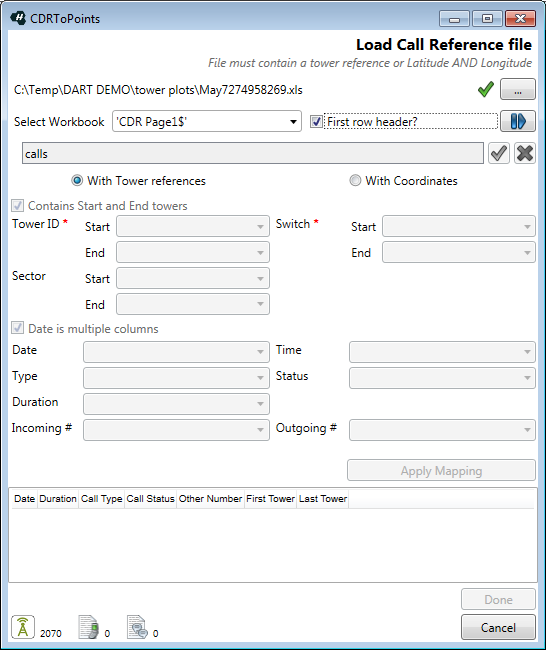
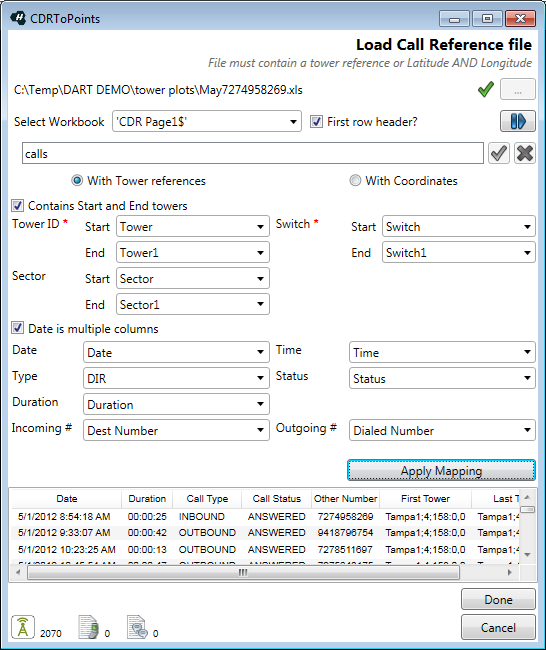
The call detail record file must have at minimum a Tower ID, and a Switch ID. Additional data may be provided and should be mapped if possible to assure an accurate call detail plot. Select the call detail file and indicate if the first row of the file has headings. Click the blue <Load> button and load the file.
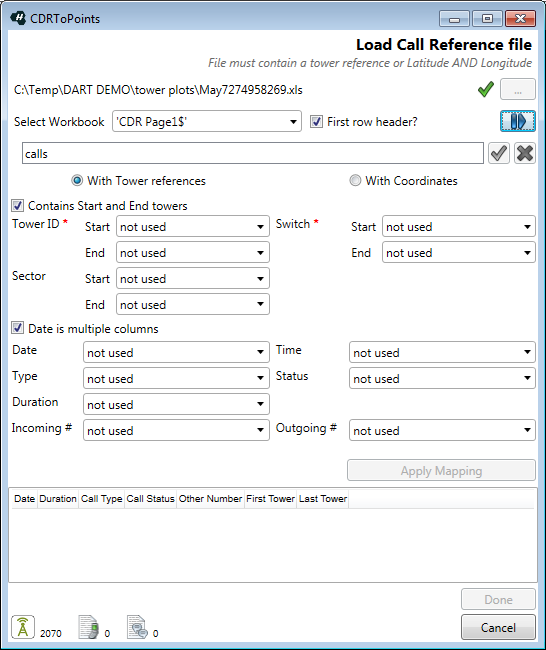
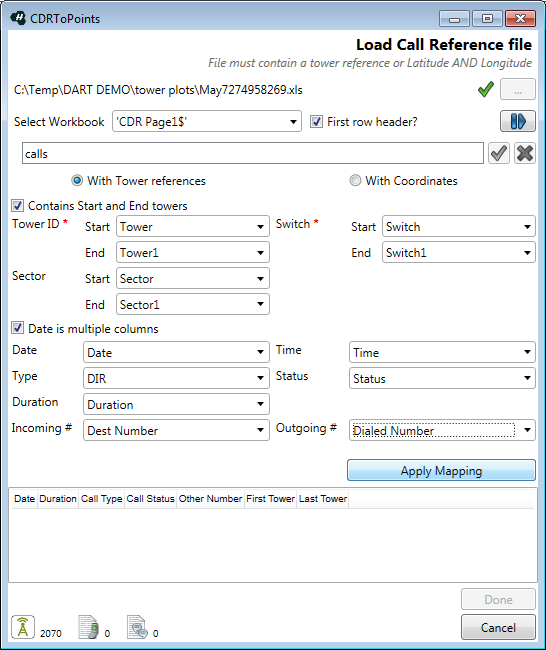
Map each field for the call detail data using the drop down next to each field to be mapped. If the call detail record has start and end towers for each call, place a check in the box. When mapping the data, be sure to map the correct start and end data. If the field is not in the file, select “not used” for that field.
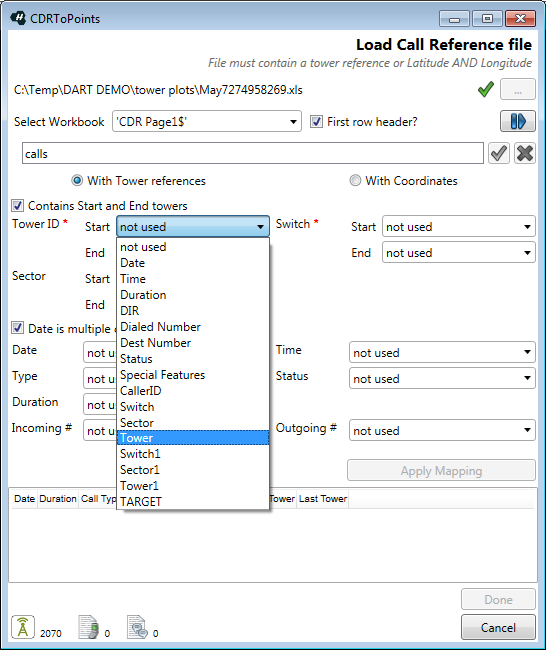
Continue this through the fields and click <Apply Mapping> when finished.
There is an option to save the mapping for future use. This can be helpful when importing multiple call detail records from a given provider. To save the mapping for future use, click <Yes> in the dialog and give a name for the mapping.

Click <OK> to save it and add the imported tower points to the tower reference file map Data Preview.
When call detail data appears correct click <Done> to close the dialog box. The number of call detail entries are shown in the bottom left of the dialog box.

If there are no more call details to enter at this time, click <I’m Done> to merge the data and finalize the import. A progress bar shows the progress of the merge.
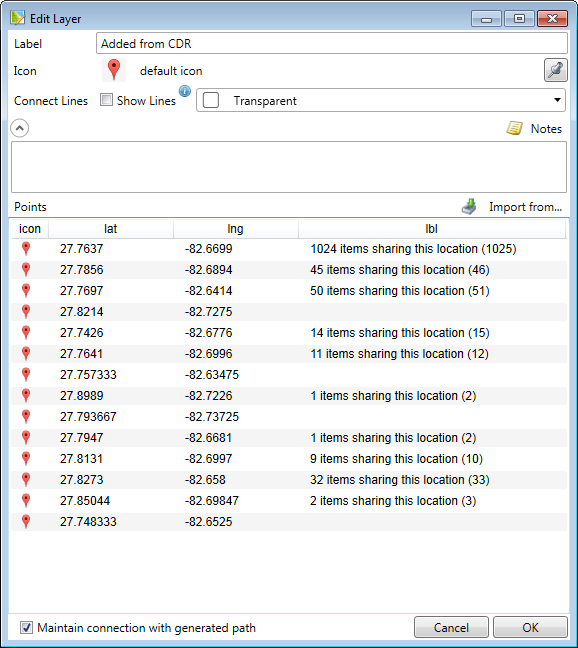
The Edit Layer dialog opens, and the attributes of the new CDR layer can be added. To change the Label for the new layer, simply type in the new label for the layer in the space provided. To change the default icon for the layer, click the gray pin <Icon> and select from the stored icons in the program. Draw connecitng lines between the points in the layer by putting a check in the <Show Lines> checkbox, and selecting a line color from the drop down box. The color ‘transparent’ is the system default, and the lines won’t show up unless a color is selected.
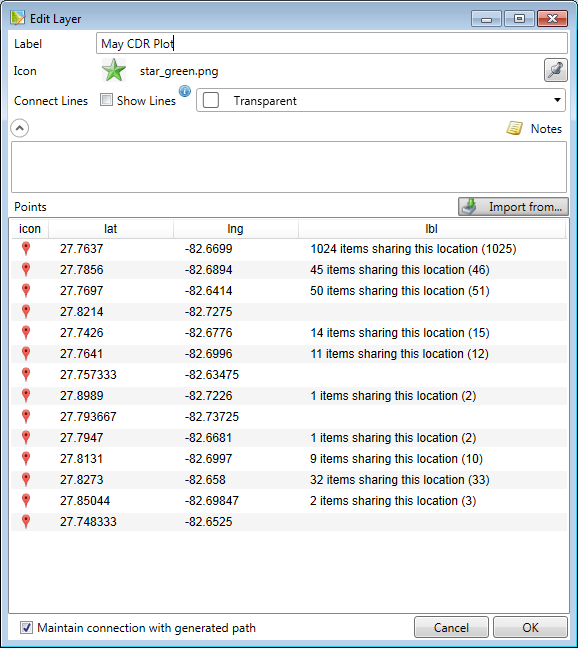
Click <OK> to plot the points on the map.
.