The Manual Plotting feature provides a web-based mapping utility to plot data points from CDRs, cell tower dumps, manual points of interest, addresses, etc. The computer must be connected to the internet for this feature to be available.
Mapping is done in layers and the layer stacking can be adjusted in any order. Individual points in each layer can be arranged and connected with lines to show connections or patterns. Radius markings can be added to points for triangulation plotting. Custom icons and notes can be added to points for clarity. The Map pages can be saved, printed, or exported to a KMZ file for importing into Google Earth.
Initial View
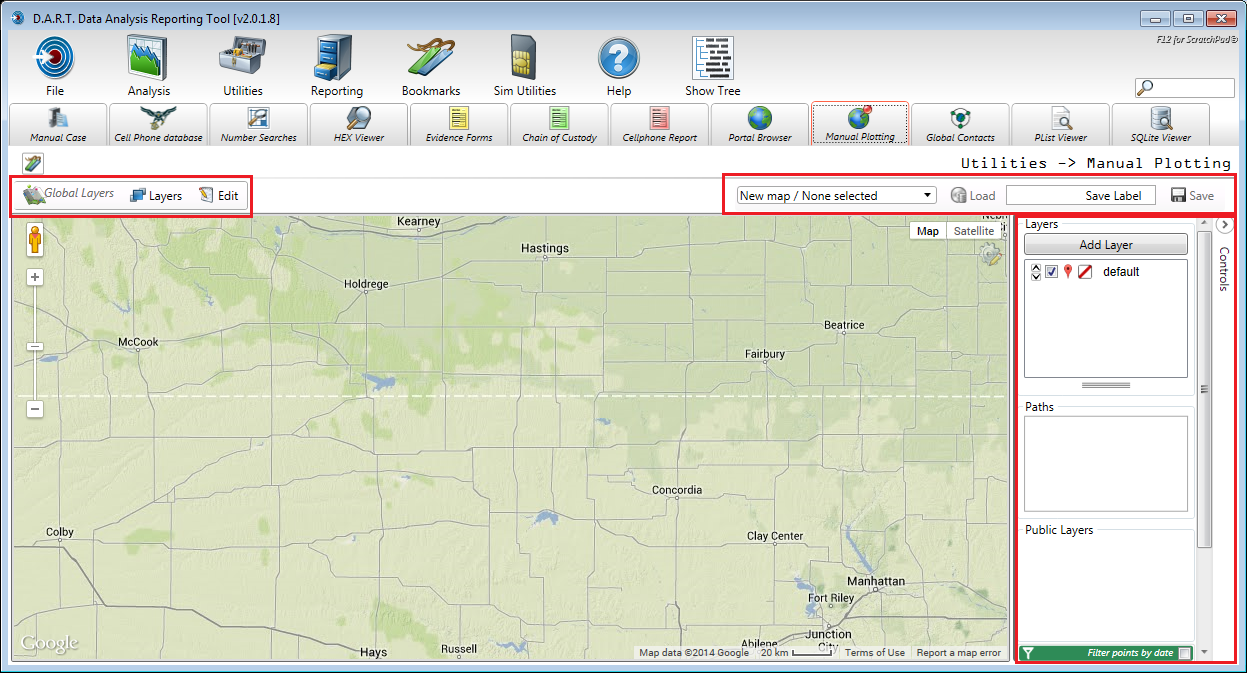
The initial view of the Manual Plotting main screen shows a starting page with a preloaded map and several controls: Global Layers, Loading and Saving Maps, Map Controls, and the standard Google Maps screen (Interaction).