
Click the import arrow next to “Marker Tools” and select “Custom – AT&T Text. This was designed for a specific text file from AT&T which included voice, data, and SMS information.
Once points are plotted, double click on any of the markers on the map to edit/modify/adjust/add to the information on the map and/or the icon. Double click on the marker to open a “Marker Properties” box.
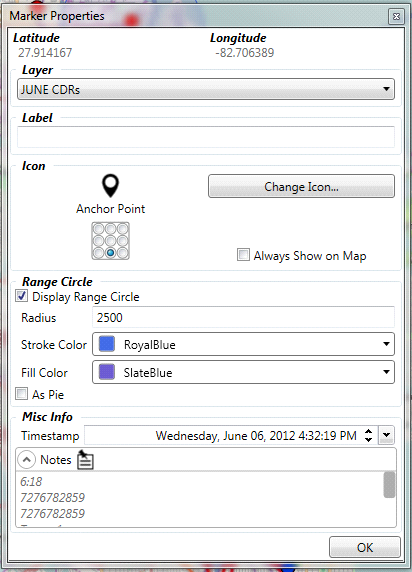
Add a label to the marker, change the icon, and anchor point if desired. It is important to set the right anchor point for the icon chosen, otherwise, the markers would look “off”. If desired, check the box next to “Display Range Circle” to add a range circle or pie around the marker. The radius value is typically provided by the phone company when records are subpoenaed. However this information may need to specifically requested in the subpoena. Change the stroke color (outline) and fill color as desired. Click <OK> to save the changes and a range circle is displayed around the marker.
To get a more specific range of the direction the panel on the cell tower was facing when it received the “ping” display a pie off of the marker. This information also comes from the telephone company, but as with the radius it may need to be specifically requested in the subpoena. To display a pie, check the box next to “Display Range Circle” fill in the box next to “radius” with the radius of the circle, then check the “As Pie” box. Move the slide bar along the “Heading” and “Angle” lines until the right numbers are shown. Choose the “Stroke Color” (outline) and “Fill Color”.
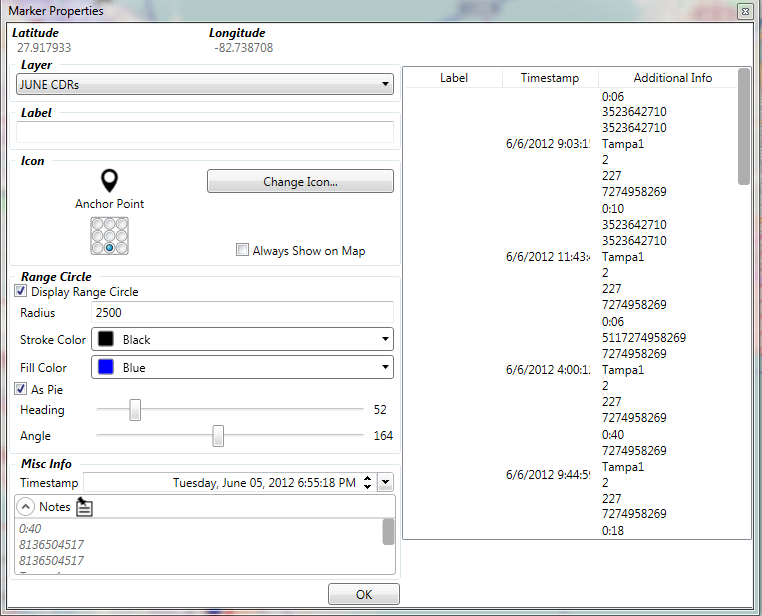
Click <OK> to save the changes and have them appear on the map.
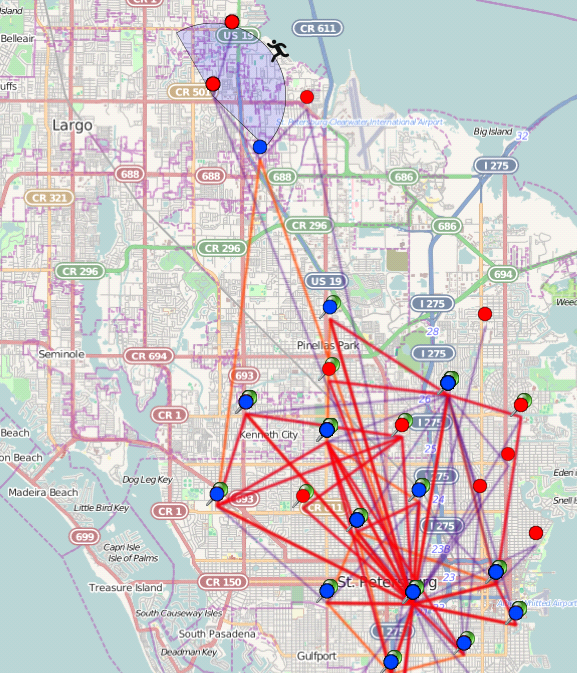
Layers can be turned on and off by checking and unchecking the boxes next to the layers in the “Layers” box on the right of the screen